
App · Productivity
Bar Chart Creator
Beautiful bar charts in seconds
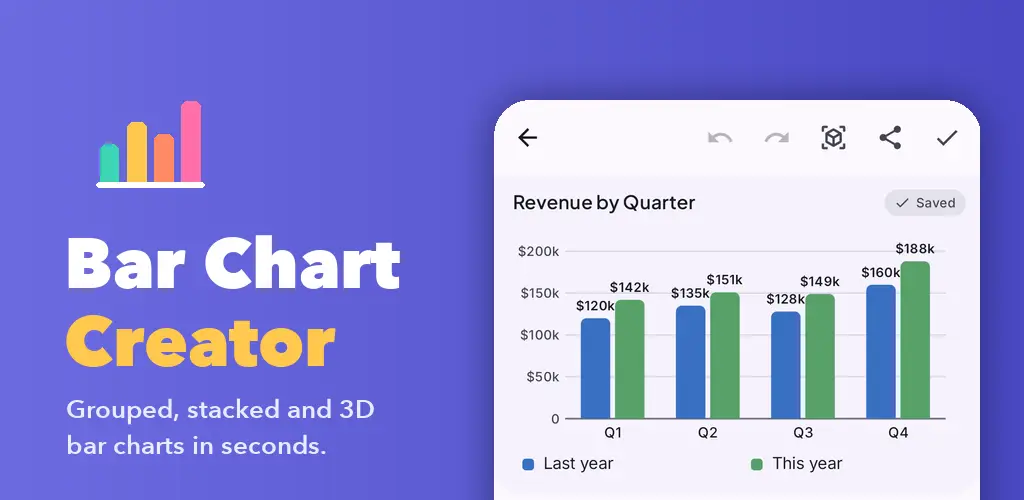
Bar Chart Creator lets you turn any set of numbers into a clean vertical, horizontal, grouped, stacked or 3D bar chart, then save it or share it as an image or PDF. It is made for students, teachers, small business owners and anyone who needs a quick, good-looking chart without a spreadsheet.
Features
What it does
Create in seconds
Type labels and values and watch your bar chart update live. Your work saves automatically, with undo and redo for every change.
Vertical or horizontal
Flip your bars with one tap, sort them as entered, ascending or descending, and drag to reorder.
Grouped and stacked series
Compare up to 6 series side by side or stacked, with stack totals. Negative values hang below the zero line.
3D view
Turn any chart into 3D columns, drag to rotate it, adjust the tilt and bar depth, and tap a bar to see its value.
Labels, gridlines and axes
Turn value labels, gridlines and axis titles on or off, and add a currency or unit such as $, €, ₹, kg or %.
Themes and color palettes
Choose from light, dark, AMOLED black and Material You themes plus 12 hand-picked color palettes, all free.
Share anywhere
Share a sharp, high-resolution image to WhatsApp, email or social media, or save it to your gallery.
Export PDF and CSV
Export a chart with its data table as a PDF, or move your data in and out with CSV files, one column per series.
Ready-made templates
Start from templates like monthly sales, budget vs actual, survey results, sales by region and screen time.
FAQ
Common questions
Is it free?
Yes. The app is free and supported by ads.
Do I need an account?
No. There is no sign-up. Just open the app and start making charts.
Where are my charts saved?
Your charts are stored only on your device. They are never uploaded to any server.
Does it work offline?
Yes. You can create, edit, save and share charts without an internet connection. An internet connection is only used to show ads.
Will my shared charts have a watermark?
No. Images and PDFs you export are clean, with no watermark.
How many ads will I see?
Very few. The app shows an occasional full-screen ad after you save or share a chart, never while you are editing.
Can I compare more than one set of numbers?
Yes. Add up to 6 series and show them as grouped bars side by side or stacked on top of each other.
Can I use negative numbers?
Yes. Negative values are drawn below the zero line, in both 2D and 3D.
Can I view my chart in 3D?
Yes. Open any chart in the 3D view to rotate it, change the tilt and bar depth, and share the 3D version as an image.
What formats can I export?
You can share or save charts as PNG images, export them as PDF, and export or import chart data as CSV files.
Support
Found a bug or have an idea? Email [email protected] with your phone model and Android version.